By default, Graphite stores data in WhisperDB, a fixed size database with configurable retention periods for various resolutions. What this means is that you can store higher resolution data (say data for every 5 seconds) for a shorter period of time (e.g. 1 month) and then store the same data at the lower resolution (say for every hour) beyond that time period. The data will be consolidated based on the the method you configure (sum, average). This behaviour of Graphite is well known.
What is not so well known is that Graphite also does consolidation when you view the graphs. This happens when the number of data points is more than the number of pixels. In such cases, the Graphite graph renderer will consolidate the data into one point using an aggregation function. The default aggregation function is average. So you might end up seeing smaller values than you expect.
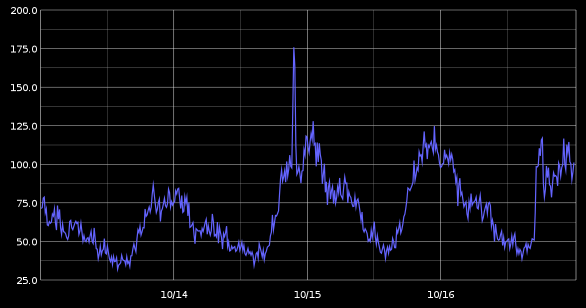
Here's an example of a graph where there are more data points than pixels. The actual peak value was a little over 200, but you cannot see it here due to averaging.
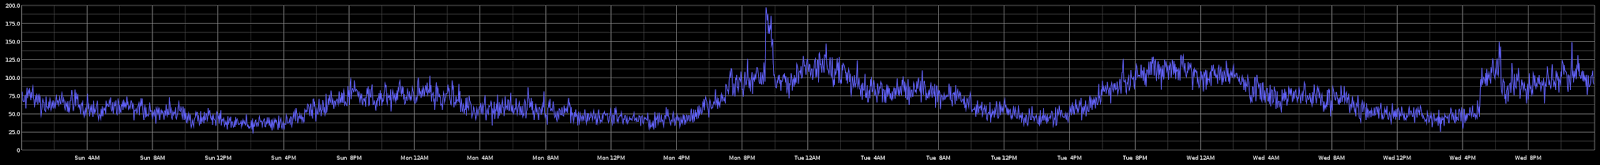
Here is the same graph (same data for the time span) where the image width has been increased* (== more pixels). You can see the peak is almost 200.
 |
| Click to view larger |
Sometimes this behaviour may not be what you want. To see the "actual" data points irrespective of what size your image is, Graphite's URL API provides a property called minXStep. To use it simply add the property as a request parameter (with value 0) in the graph URL. From the documentation:
To disable render-time point consolidation entirely, set this to 0 though note that series with more points than there are pixels in the graph area (e.g. a few month’s worth of per-minute data) will look very ‘smooshed’ as there will be a good deal of line overlap.
The same graph with minXStep=0 now looks like this:
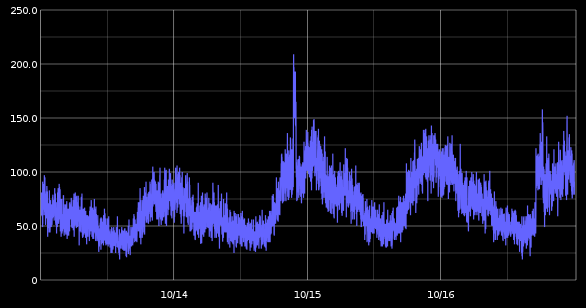
A bit "smooshed" but with the exact data that was collected.
* Pass width=x as a request parameter to the graph URL, x in pixels